Getting Started with Oracle BI Publisher 11g
Purpose
This tutorial covers how to get started with Oracle BI Publisher 11g to create simple reports based on Oracle Database. Also, it teaches you how to create report layouts using the Layout Editor online, and how to schedule reports.
Time to Complete
Approximately 1 hour.
Overview
Oracle BI Publisher is a strategic enterprise reporting product from Oracle that provides the ability to create and manage highly formatted reports from a wide range of data sources. Oracle BI Publisher is available as part of the Oracle BI Enterprise Edition Suite and also as a stand alone reporting tool. Oracle BI Publisher report formats can be designed using Microsoft Word or Adobe Acrobat, the tools that are easy to use, and most users are already familiar with. Oracle BI Publisher also allows you to create reports from different types of data sources such as Oracle Database, Files, BI EE, Web services, and Discoverer.
Release 11g of Oracle BI Publisher has enhanced, easy- to-use user interface (UI), many enhanced features, and newly introduced salient features such as - Data Model Editor - a graphical user interface for building data models within the BI Publisher interface; and Layout Editor - a design tool that enables you to create report layouts within the BI Publisher interface.
In this tutorial you will be guided to create simple reports in BI Publisher based on Oracle Database. You will also be guided to work with the Layout Editor to create the layouts for the reports.
Prerequisites
Before starting this tutorial, you should:
| 1. |
Have access to Oracle BI Publisher 11g or installed BI Publisher 11g as stand alone or as part of Oracle BI Enterprise Edition 11g.
Also, it is recommended to use the following versions of browsers - Internet Explorer 7.0 (or above), Mozilla Firefox 3.6.3 (or above).
|
|---|---|
| 2. |
Have access to an Oracle Database11g (or 10g) with the sample schemas HR and OE installed and unlocked.
The exercises in this tutorial use the HR and OE schemas included in the Oracle Database.
|
| 3 . |
Have executed the Repository Creation Utility ( RCU) scripts in Oracle Database 11g. This should be done before installing Oracle BI EE. RCU creates the BI Publisher scheduler repository.
Note: BI Enterprise Edition (BI EE) installer comes with these out of the box RCU scripts, that create the necessary schemas and the repositories in the Database for various components of BI EE including BI Publisher. You need an Oracle 11g Database to run these RCU scripts.
However, you can establish a JDBC connection and create data models and reports through BI publisher using both 10g and 11g Databases. |
Getting Started with BI Publisher
This topic guides you to login to BI Publisher and get started. It has the following subtopics:
- Logging in to BI Publisher and Navigating the Home Page
- Browsing the catalog and Viewing reports
- Setting Preferences
Logging in to Oracle BI Publisher and Navigating the Home Page
| 1 . |
Enter the URL for BI Publisher in the browser window, which is of the format-
http://<hostname>: <port >/xmlpserver/. For example- http:/localhost:7001/xmlpserver/
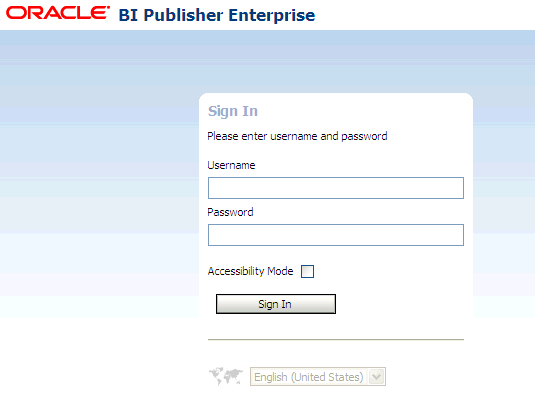
This opens the Oracle BI Publisher Enterprise login page-
 |
|---|---|
| 2 . | Login as a user with BI Administrator privileges. When you login to BI publisher, the Home page is displayed- 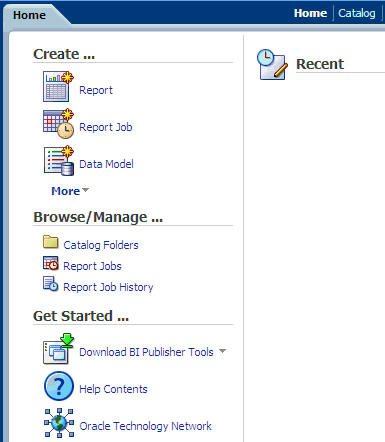 |
| 3 . | The Home page is a task-oriented, centralized workspace combined with a global header, allowing access to Oracle BI Publisher objects, their respective editors, and help documentation.
Observe the various sections of the Home page ( greatly enhanced in 11g release to enable the users get started quickly with BI Publisher) :
For example you can see -
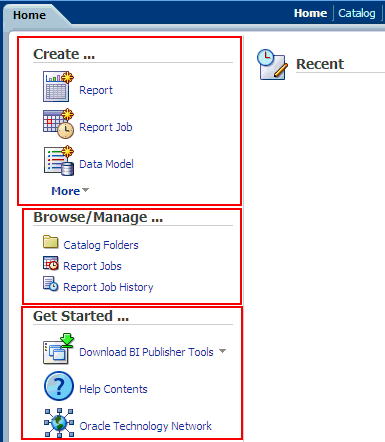
Also, try the enhanced Search capability that enables you to search for objects by type.
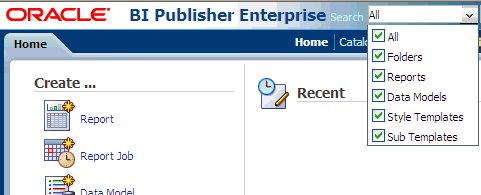 |
| 4 . |
On the upper right side you can see the links for the Home page, Catalog, drop-down lists New, and Open.
 Note: All these features make the navigation within BI Publisher easy for report developers and users. |
Browsing the Catalog and Viewing the Reports
| 1 . | Follow the steps listed here to browse the catalog and open a sample report (predefined).
Click the Catalog link in the Browse/ Manage section ( or Click the Catalog link found on the right side of the Home page).
  |
|---|---|
| 2 . |
The Catalog page is displayed as a tree structure on the left side of the page with the details on the right.
See that the objects such as reports, data models are organized into folders.
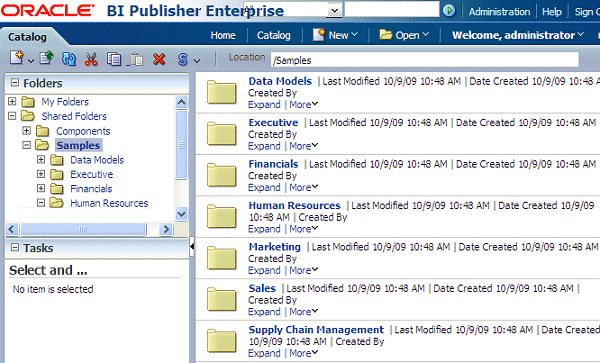 Note: The Samples folder found in Shared Folders contains a set of predefined sample reports. You will open one of these reports. |
| 3 . | Also see the tool bar with New drop-down menu that enables you to create new reports, scheduled jobs, data models and so on.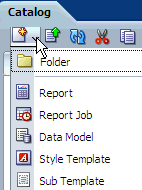 Note that the tool bar also has other options such as copy, cut, paste, and other options that can be used when creating or managing the catalog objects such as data models, and reports. 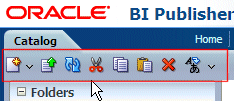 |
| 4 . |
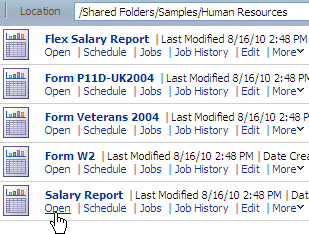
Navigate to the Human Resources folder in Samples. (This displays all the objects in the Human Resources folder.)

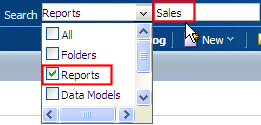
You can also search for a report (or other objects) using some key word and view it. For example, in the Catalog page, select the Reports check box from the Search drop-down list, and enter a key word in the Text field beside it. In the example below, the search results in a list of reports that have "Sales" in name.
 |
| 5 . |
Click Open link below the Salary Report.
 |
| 6 . |
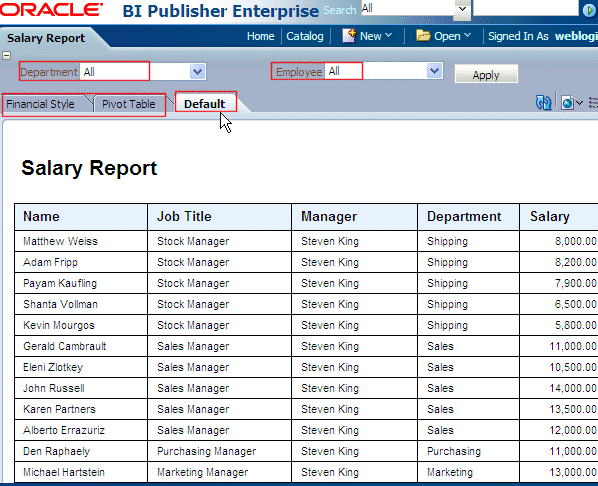
The Salary Report is opened in view mode. The report data is displayed using the Default layout. All the predefined layouts for the report are displayed as different tabs.
 You can also view the report using any of the supported formats. Click View icon displayed on the top of the report viewer towards the right. (Highlighted in the screen below). 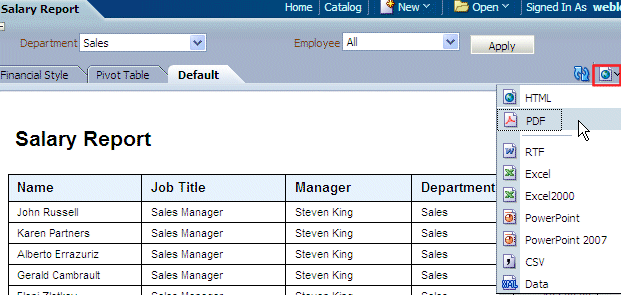 |
| 7 . | Also, note the parameters defined in the report -Department and Employee, that display drop down lists for department names and the employees working in the corresponding departments. For example, when you select Finance as the Department, and the Employee list shows the employees working in Finance department.  |
| 8 . |
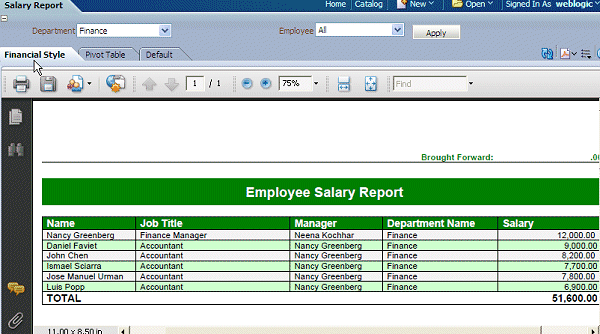
You can click Financial Style, and Pivot Table tabs to view the data in report using these predefined layouts.
The following screens shows data for the Finance department using Financial Style layout:
 The followings screen displays data for the Sales department using Pivot Table layout. 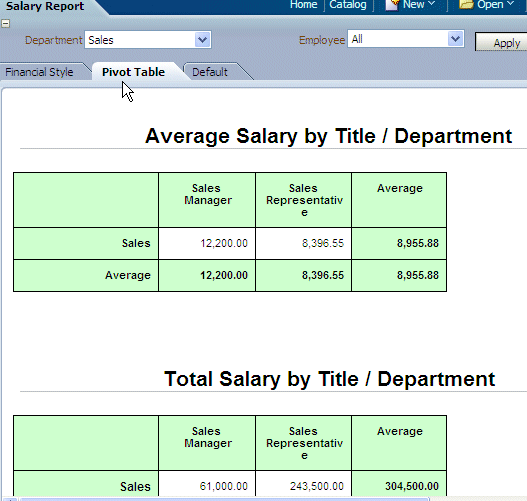 |
Setting Preferences
| 1 . |
To set the Preferences , Click on the link Signed in as <user>, and select My Account from the drop-down list.
 |
|---|---|
| 2 . |
This displays the Preferences screen with the General, My Group tabs/ links as shown in the screen below:
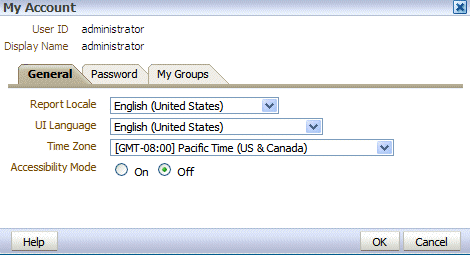
You can set the Report Locale, UI Language, Time Zone, and Accessibility Mode in the General Preferencessection.
|
| 3 . |
Click the My Groups tab to view a list of the application roles to which you are assigned. You cannot modify this list.
 To change your password, click the Password tab of the My Account dialog. Note: Password tab is visible only when you use BI Publisher Security. |
Configuring the Data Sources
Types of Supported Data Sources
Oracle BI Publisher supports various types of Data Sources such as JDBC data sources (Oracle Database, and other Databases), XML Files, BI EE Reports (Answers), JNDI data sources, OLAP data sources, Fusion Application Data sources, Web Services, HTTP data sources, and Discoverer.
Before you create a data model based on these data sources, you need to configure a connection to these data sources first. In this topic, you will learn how to configure a JDBC connection to an Oracle Database, and also you learn how to define a File data source.
This topic has the following subtopics-
- Defining a JDBC Connection
- Configuring File Data Location
- Defining a JNDI Connection
Defining a JDBC Connection
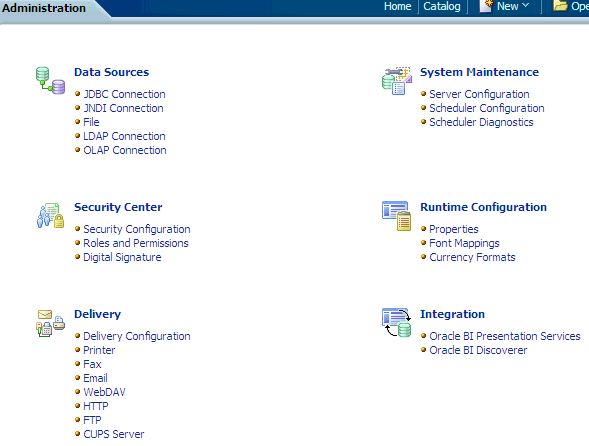
| 1. | To define a JDBC connection click the Administration link found on the right side of the BI Publisher page.
This displays the BI Publisher Administration page as shown below (Observe the Data Sources section in the screen below):
 |
|---|---|
| 2. |
Click the JDBC Connection link found under the Data Sources section in the Administration page.
 |
| 3. |
This displays the Data Sources page. In the JDBC section, click Add Data Source to create a JDBC connection to your database.
 |
| 4. |
In the Add Data Source page that is displayed, enter the details as given below -
Do not click Apply or Cancel after defining the above details. Click Test Connection.
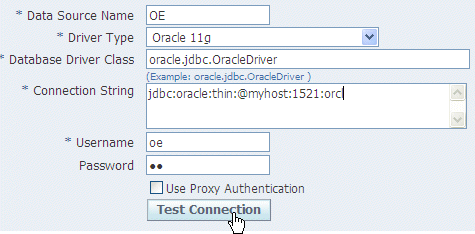
Note: To continue with this tutorial exercises, the sample schemas OE, and HR should be installed in your Oracle Database as mentioned in the Prerequisites. Else, you will not be able to define this JDBC connection.
|
| 5 . |
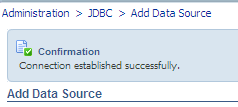
If the connection to the database is established, a confirmation message is displayed indicating the success.
( As shown in the screen below).
Then click Apply.
 |
| 6 . |
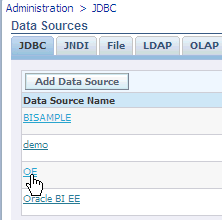
You can see this newly defined connection (OE) in the list of JDBC Data Sources.
 |
| Note: You can also set up the the default connection demo to point to OE schema in your database, as the samples use this connection. Then the demo connection can be used as the default data source for this tutorial too. |
Configuring File Data Location
| 1. | BI Publisher ships with a repository of various sample files and reports. These are available in BI Publisher home.
To define a File data source, click the File tab in the BI Publisher Administration page.
Click the demo files link to update the file location.

( If you want to create a File data source with a different name, you can click Add Data Source. )
|
|---|---|
| 2. |
Define the top level directory which has all the sample files (repository).
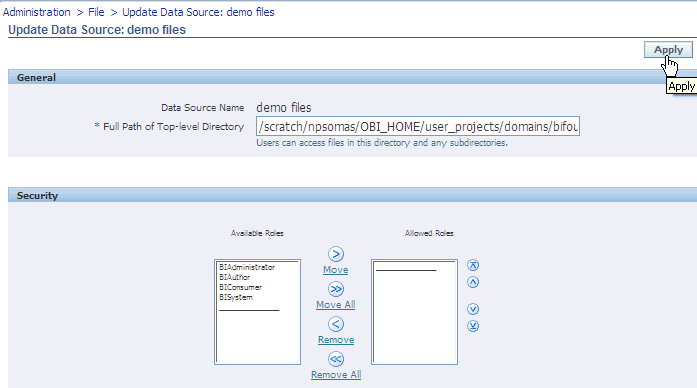
( Using this demo files data source, users can access all the files in the top level directory and also it's subdirectories).
|
Defining a JNDI (Java Naming and Directory Interface) Connection
BI Publisher supports connecting to a JDBC data source via a connection pool. Using a connection pool increases efficiency by maintaining a cache of physical connections that can be reused. When a client closes a connection, the connection gets placed back into the pool so that another client can use it.
Note: JNDI Connection concept is briefly introduced here, as you need to first set up the connection pool in your application server and access it via Java Naming and Directory Interface (JNDI). Then, you can define the JNDI connection in BI Publisher by entering the required fields in the JNDI connection definition page, so that BI Publisher can utilize the pool to establish connections.
Creating a Data Model
In release 11g, Oracle BI Publisher introduces the Data Model Editor, a graphical user interface for building data models within the BI Publisher interface. It enables you to perform the following tasks:
- Create Data Sets - Access data from a wide range of sources: RDBMS, OLAP, WebServices, BI Analyses, XML files, Excel and others.
- Query data - Build SQL or MDX queries to extract data from relational or multidimensional (OLAP) data sources.
- Structure data - Define master-detail relationships between data sets to group data at multiple levels to optimize document generation.
- Aggregate data - Create group level totals and subtotals.
- Customize data - Modify data field names to conform to business terms and reporting requirements.
- Create calculations - Compute data values that are not stored in the underlying data sources that are required for reporting.
- Advanced tasks - Define parameters and lists of values (LOV), triggers, and other advanced elements as required by reports and report users.
In this topic, you are guided to create Data Model based on SQL query using the JDBC connection you defined in the previous topic. Also, you will learn how to add parameters and LOVs to the data model.
Defining Default Data Source, and Output Options
| 1. | Note: Before starting the creation of Data Model, you will first create a folder to save all your objects such as reports, data models and so on.
In the Home page, click Catalog link under the Browse/Manage section.
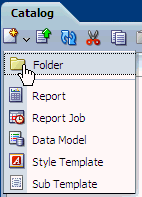
In the Catalog page that is displayed, select the My Folders node, click the New icon on the tool bar. 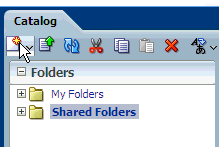
Select Folder from the drop-down menu to create a new folder.
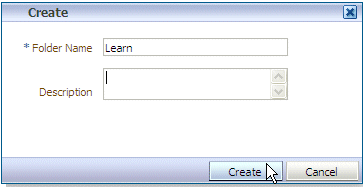
Enter Learn as the name of the folder, (optionally enter a description), and click Create.
You can see that the folder gets listed in My Folders.
|
|---|---|
| 2. | Now, you can invoke the Data Model editor in one of the following ways-
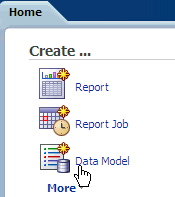  |
| 3 . |
Observe the Data Model Properties page that is displayed on the right.
Select a Default Data Source (that points to the OE schema in your database). Optionally, add a description to the data model. 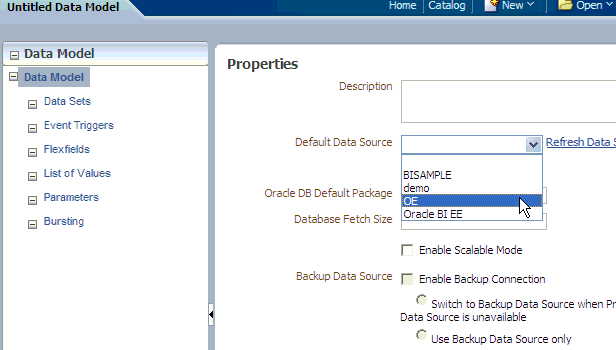 Note:
|
| 4 . |
To save the data model with a name, click Save As icon found at the top right corner of the page.

Navigate to the folder that you want to save the data model object ( Learn in this example), enter an appropriate name for the Data Model , and click Save.
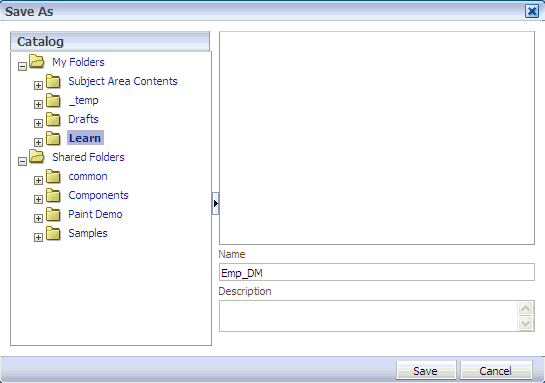 |
Creating a SQL Query Data Set with Parameters and LOVs
| 1 . | From the Data Model task pane on the left, select Data Sets.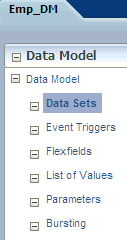 |
|---|---|
| 2 . | From the Data Set drop-down menu, select SQL query as the type of data set.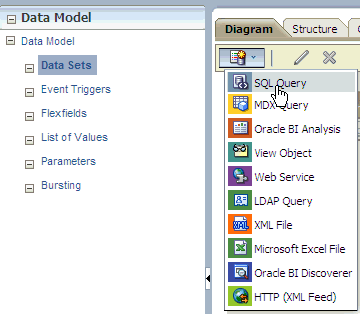 |
| 3 . |
In the Create Data set -SQL dialog box that appears, enter an appropriate name for the data set, accept the default data set option (as you have already defined it in the Data Model), and click Query Builder to create a query.
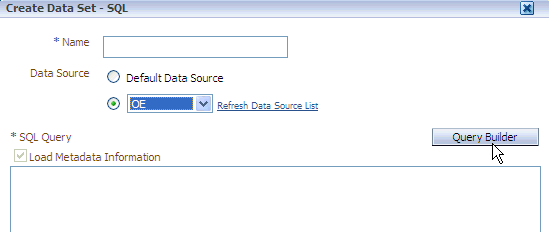 |
| 4 . | The Query Builder window appears displaying the OE schema objects on the left side. Click DEPARTMENTS, and EMPLOYEES tables to add them to the Model canvas on the right. 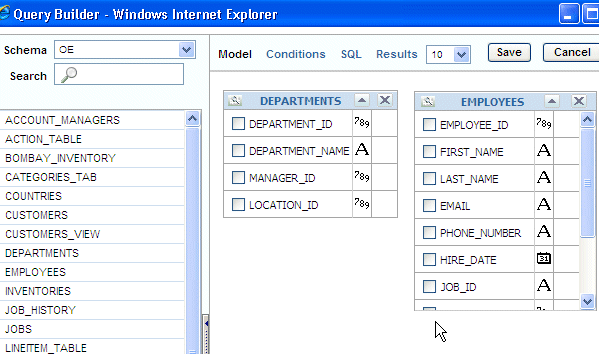 |
| 5 . |
Now, define a join between these two tables as follows:
Click the box beside DEPARTMENT_ID column in the DEPARTMENTS table. Similarly click the box beside DEPARTMENT_ID column in the EMPLOYEES table. (These boxes, when marked for joins turn light gray. ) Also note that a fine line joining the tables appears in the Model canvas. 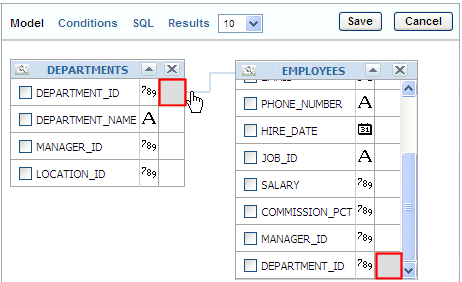 |
| 6 . |
Select the following columns from the tables (by selecting the check boxes beside the column names):
-Select DEPARTMENT_NAME from the DEPARTMENTS table -Select FIRST_NAME, LAST_NAME, HIRE_DATE, and SALARY columns from the EMPLOYEES table (See the screen below) 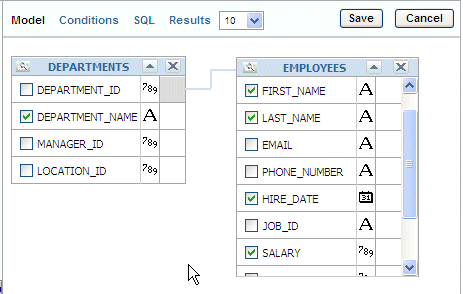 |
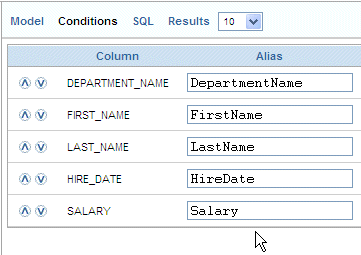
| 7 . | Click the Conditions Tab . Change the column names and remove "_" to have more appropriate aliases. Change the aliases for the columns as below:
 |
| 8 . | Also, type "IN (:P_DNAME)" in the Condition field for the department name column, as shown in the screen below . This will define a parameter P_DNAME on the department name column.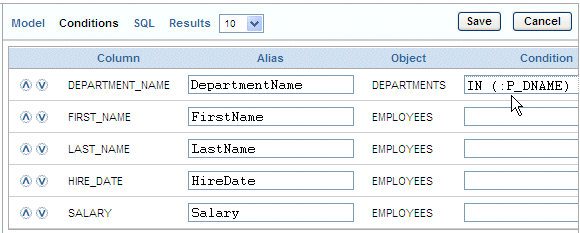 Note: The IN condition is being used here for the parameter to accept All or Multiple values for the department name column. The aliases and display names can be changed in the Data Model page, either in the Diagram or in the Structure too:  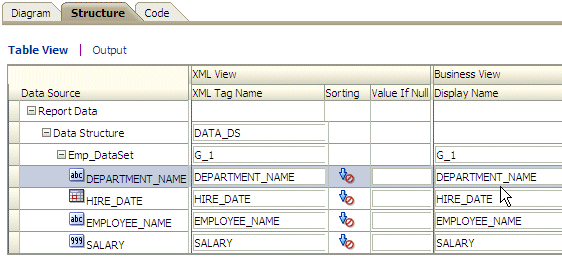 |
| 9 . |
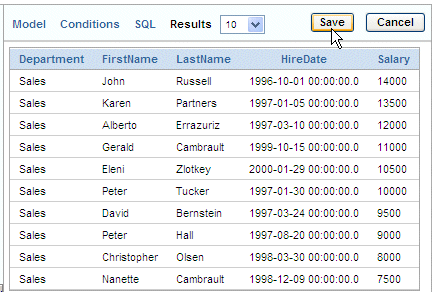
Click Results to see how the query results appear in Query Builder.This will prompt you to enter a department name for the parameter, enter Sales and click OK.

View results. Click Save to save the query.
 |
| 10 . |
This takes you back to the Create Data set -SQL dialog box, and observe that the query you created is reflected in the SQL Query area.
Enter an appropriate name such as Emp_DataSet, and click OK to add this data set to your data model. 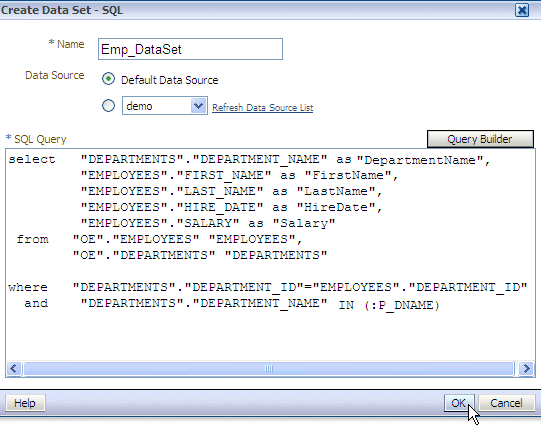 |
| 11 . |
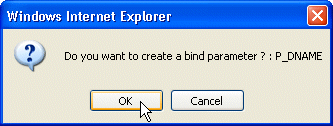
A message asks whether you want to create a bind variable. Click OK. to create the parameter
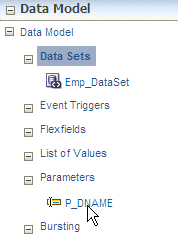
Note that the parameter created is listed on the left under Parameters node in Data Model:
Every time you make changes to the Data Model (changes to the data set, adding parameters or any other changes), click Save icon (found at the top right corner) to save the Emp_DM data Model .
|
| 12 . |
In the Data Model pane, click List of Values node. In the List of Values pane click the the + sign to Create new List of Values.
Select the following Options:
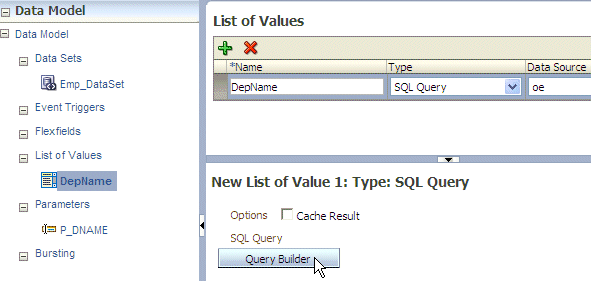 |
| 13 . |
In the Query Builder page, select DEPARTMENT_NAME from the DEPARTMENTS table. Click Save.
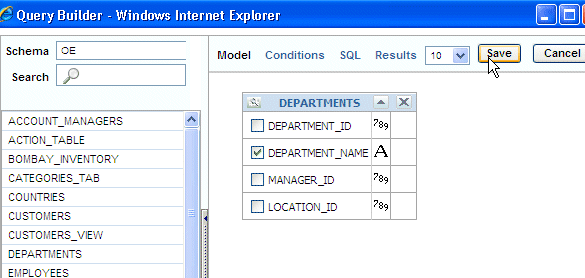
Click Save to save the Data Model. The query for the LOV should look like this:
 |
| 14 . |
Now, set the properties for the P_DNAME parameter to use this LOV:
Select P_DNAME parameter listed under the Parameters node.
Enter Default value as * (the character star) , and select Menu as the Parameter Type (the default parameter type is Text).
 |
| 15 . |
Ensure that DepName is selected as the List of Values for the parameter.
Ensure that Multiple Selection, Can select all, and All Values Passed options are selected. (These options allow you to select all / multiple values for the department.)
Also, change the Display Label to an appropriate one like- Department:
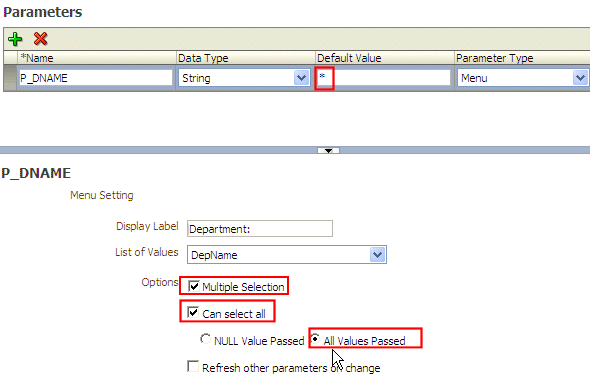 Click Save to save the Data Model. |
| 16 . |
You can edit the query manually further to concatenate Last Name and First Name columns as Employee Name. Edit the query to look like this:
Select DEPARTMENTS.DEPARTMENT_NAME as "Department Name",
EMPLOYEES.FIRST_NAME || ' '||EMPLOYEES.LAST_NAME as "Employee Name", EMPLOYEES.HIRE_DATE as "Hire Date", EMPLOYEES.SALARY as "Salary" from OE.DEPARTMENTS DEPARTMENTS, OE.EMPLOYEES EMPLOYEES where DEPARTMENTS.DEPARTMENT_ID=EMPLOYEES.DEPARTMENT_ID and DEPARTMENTS.DEPARTMENT_NAME IN (:P_DNAME)
Click OK and save the data model.
The query should look like this in Query Builder: 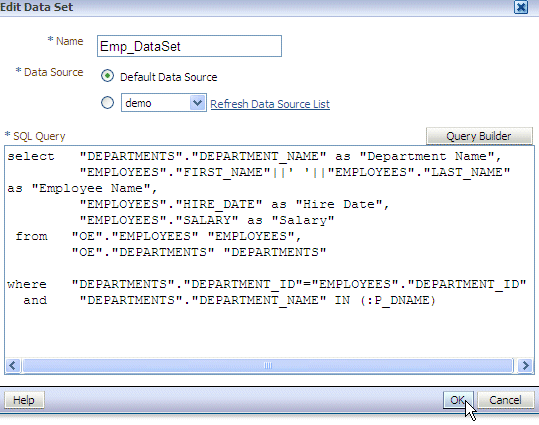
Note: Once you edited the query manually, you will not be able to edit in the Query Builder.
|
Viewing the XML Output and Saving the Sample Data
| 1 . | You may have observed that In the current version of the BI Publisher, you can preview the XML data for the data model. Click the XML icon (found at the right top corner of the page), to see the XML output for the data model you defined in previous topic.  Note that All is selected for the Department parameter (as this is the default value ). Select All for the number of rows, and click Run to see the XML data output for all the departments: ( A portion of the XML data is displayed here in the screen) 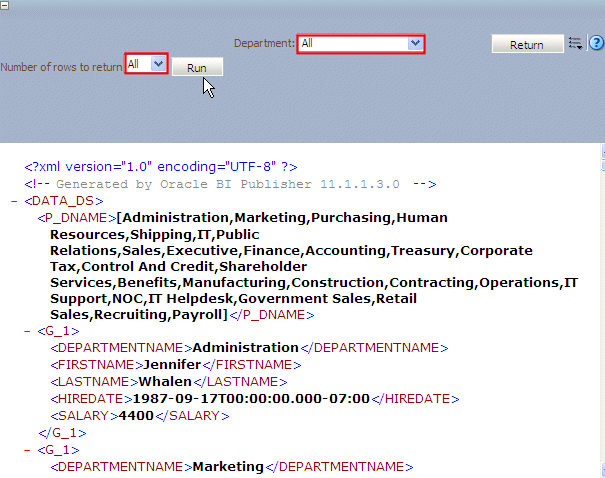 |
|---|---|
| 2 . | To save this as sample data, click the Open Menu drop-down list icon, and select Save as Sample Data.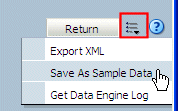 You can see that the sample.xml is listed in the Sample Data section of the Data Model ( as shown below): 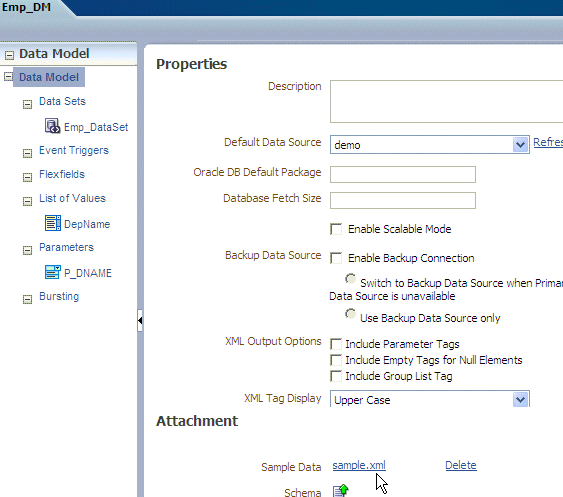 Note: It is very important to save sample data for a data model, else when creating Layouts, the previews do not appear correctly. You can select various values (multiple/ single) for Department to see the data. You can also restrict the number of rows that you want to see:  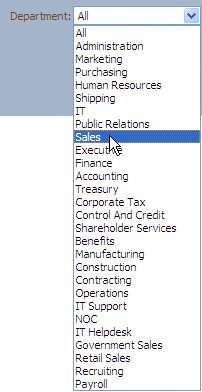 |
Creating a Report
In this topic, you learn to create a report using the Data Model that you defined in the previous topic. You also create a simple layout using Layout Editor, and edit parameters.
Note: The steps in this topic are all continuous, so do not close any window or logout from BI Publisher unless you are asked to do so.
| 1 . | If not logged in, login into BI Publisher, and go to My Folders> Learn folder in Catalog pane. Click New (found at the top left corner of page) to see the drop-down menu and click Report to create a new report. 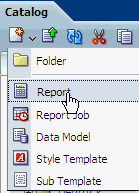 |
|---|---|
| 2 . | Navigate to My Folders> Learn. Select Emp_DM data model and click Open.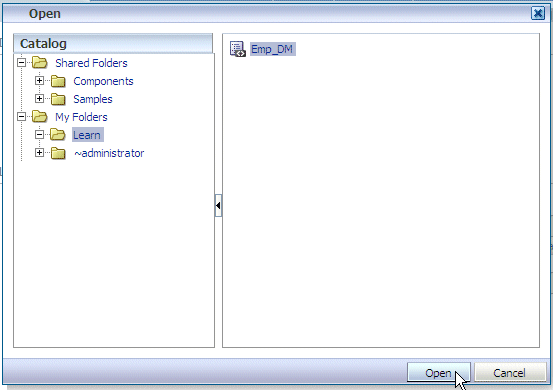 It displays the options to create, use a shared template, or upload a report layout. Select Blank (Portrait) under the Basic Templates section to create a simple report layout. 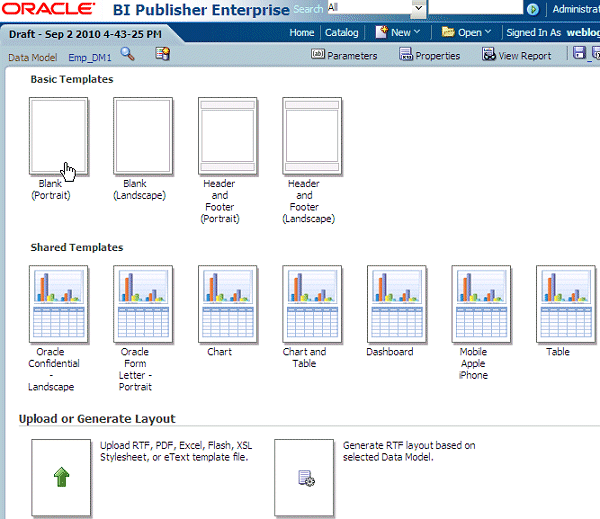 Note: You can define a Layout for the report at the time of creating report, or create it at a later point of time.Creating report layouts using the Layout Editor is covered in detail in the next topic. |
| 3. | This opens Layout Editor, with a blank page: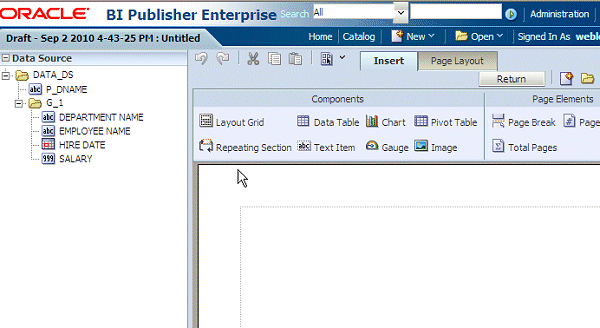 |
| 4. | Click Insert > Data Table from the menu to insert a data table in the layout page.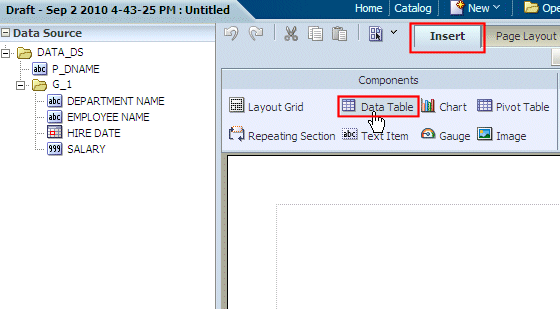 |
| 5. | Select and drag the elements in the following order from the Data Source pane to the [Drop a Data Item Here] area of the table:
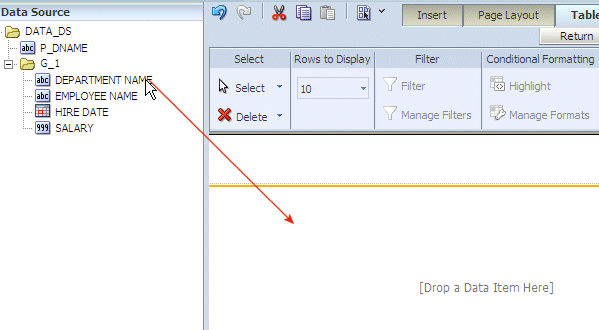 As you drag an element, position each successive item directly to the right of the previous element and release to create each column, so that the data table, after adding all the columns it looks like this: 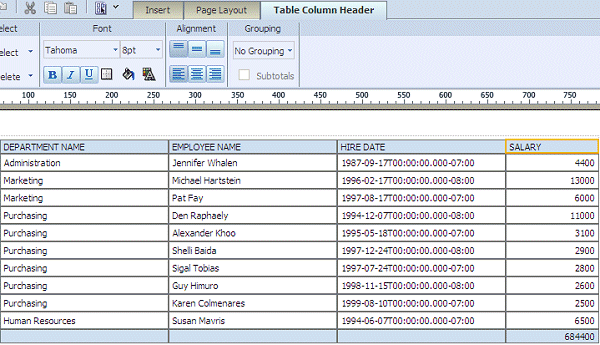 |
| 6. | Click the Save icon found on the top right corner to save this layout. Enter Default Layout as the name of the layout, and click Save. 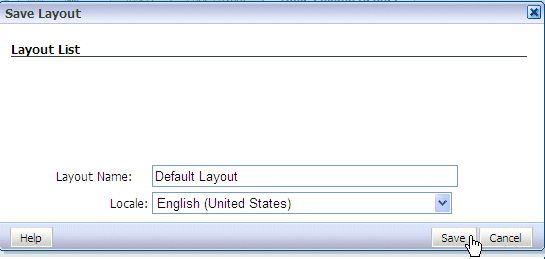 |
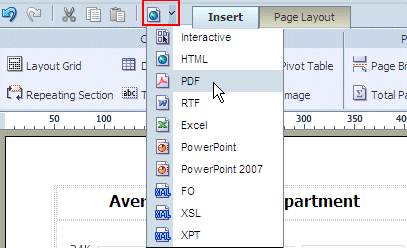
| 7. | This brings you back to the Layout Editor. Click the Preview icon drop-down list (highlighted in the screen) to preview the data in Interactive format (this is also the default format). 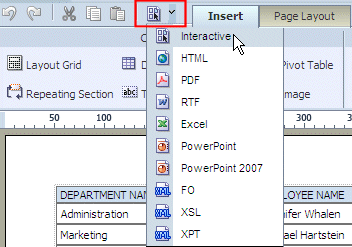  Note: You can perform sorts and selection interactively here. Close the Interactive Viewer. |
| 8. | .Click Return in Layout Editor to return to the Edit mode of the report. Observe the various links on this page that will help you edit the data model, parameters, properties, and layouts for the report. You can also display the layouts as Thumbnails or as a List. 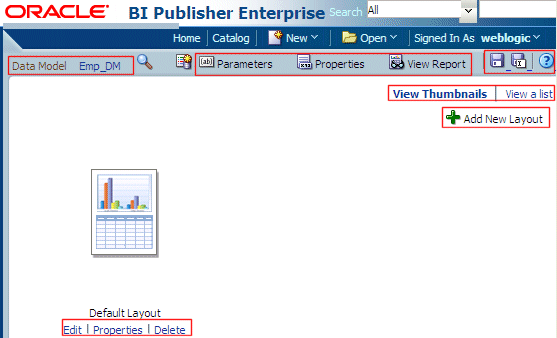 Note: Parameters link is displayed, only when the data model you selected for a report has parameters defined. |
| 9. | Click Save icon (found at the top right corner of the page) to save the report. (You can also click Save As icon ). Navigate to My Folders> Learn. Enter Employee Salaries By Department as the report name and click Save. 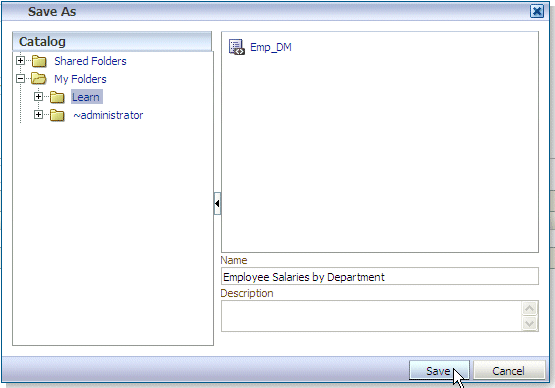 |
| 10 . | Click the Parameters link and it shows the details for the parameters. You can make changes to the parameter values. Also, you can opt to show or not to show the parameter in the report. Clear the Show check box not to show the parameter. Note: The report parameters are edited here not to show them in layouts. (This is not mandatory, but this is being done here to depict all the data in the layout graphs that you will create in the next topic.) 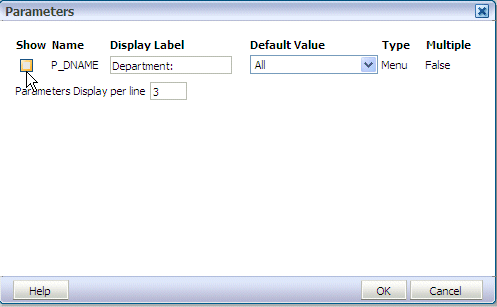 |
Building a Layout Using Layout Editor
Release 11g of Oracle BI Publisher introduces an online Layout Editor, a design tool to create and publish report layouts from within BI Publisher interface. The Layout Editor provides an intuitive drag-and-drop interface for adding common components to your report layout from within your web browser. The Layout Editor uses the sample data in the data model to immediately populate your layout components with report data during design-time. It also provides many advanced features to fully customize your reports.
The Layout Editor provides a new Interactive output type in addition to output types like PDF, RTF, Excel, PowerPoint, and HTML. Interactive output enables lightweight interactions with the report data from within the browser such as Excel-like filtering and sorting of tabular data with fixed headers and footers
In this topic, you will design a layout with graphs and using the Layout Editor, for the Employee Salaries by Department report that you created in the previous topic.
Launching the Layout Editor and Adding a Grid Layout
| 1 . | Click Return to return to the Edit mode of the report. (If the report Now, click Add New Layout link to create a new layout for the report. 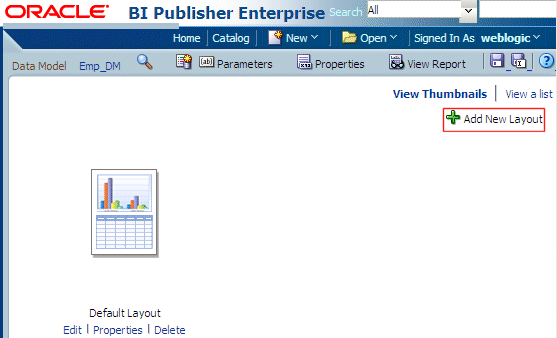 |
|---|---|
| 2 . | The Layout Editor is invoked, and displays the available Basic and Shared templates (templates for report layouts) to choose from. It displays the options to create, use a shared template, or upload a report layout. Click Blank (Portrait) from the Basic Templates section to manually design the layout. 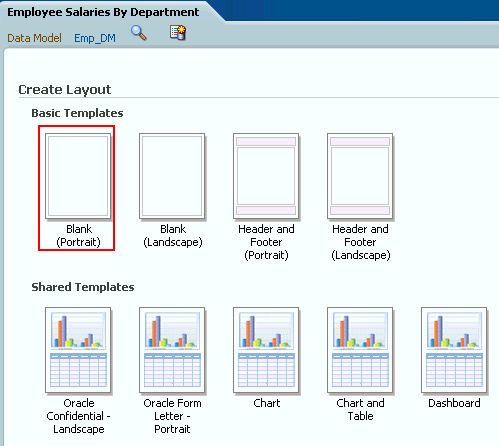 Note: It is a good practice to use Pre-built templates for reports because:
|
| 3 . | This shows blank page (portrait) in Layout Editor . Click Layout Grid to insert a grid.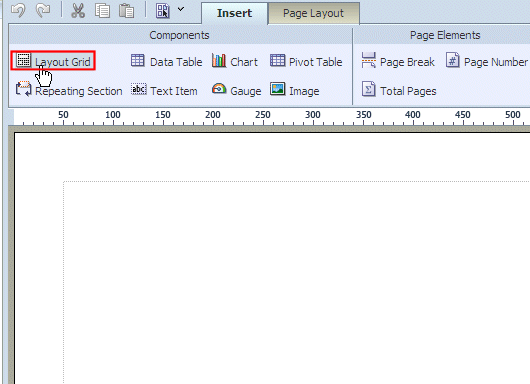 In the Insert a Layout Grid screen, enter 2 as the number of rows and 2 as the number of columns for the grid. Click OK. 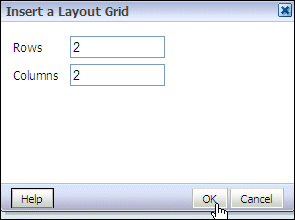 (You will add various report components such as charts, tables, and pivot tables in the the grid rows and columns in the next subtopics.) Note: Using Layout Grids to control pixel perfect placement of objects in the layout is a best practice. |
| 4. | The layout grid with 2 rows and 2 columns is added: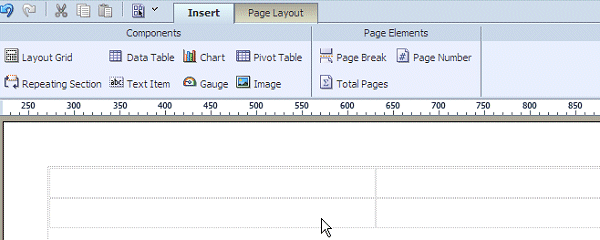 Now, merge the cells in the second row. Use <CTRL> key to select both the cells in the second row of the grid, (when the cells are selected, the color turns yellow) click Join Selected Cells option available in the Layout Gridmenu. 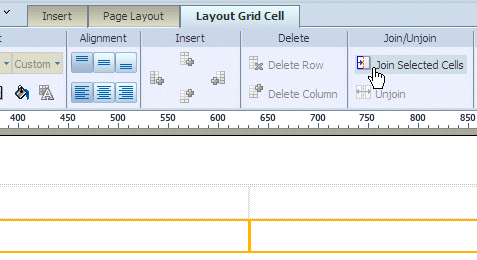 |
Working with Charts
| 5. | Select the first cell in the first row of the grid layout, and click Chart from the Insert menu in the ribbon.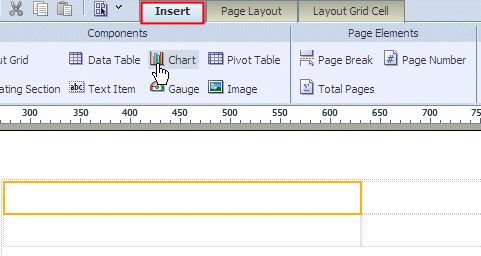 This action inserts a chart template with prompts as shown below: 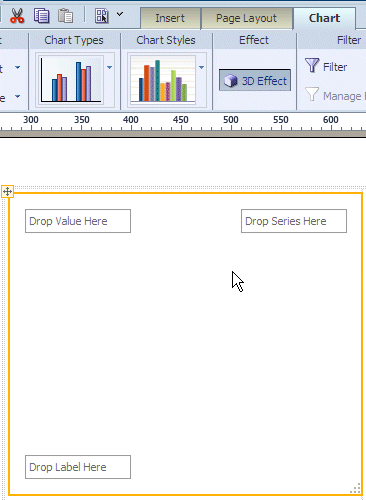 |
|---|---|
| 6 . | From the Data Source pane on the left-
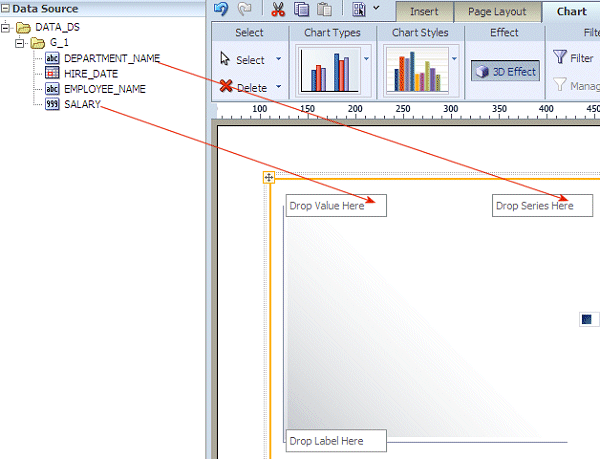 This would populate the chart with some sample data. 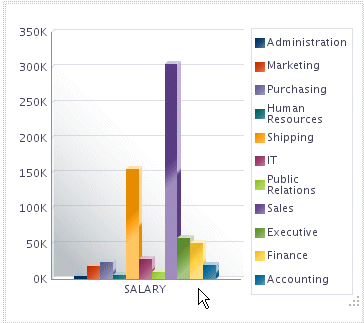 |
| 7 . | Next, change the Properties of the SALARY element in the chart to average the value.
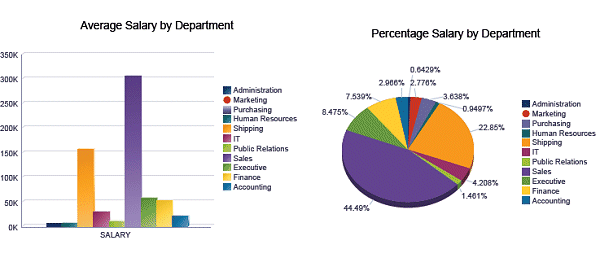
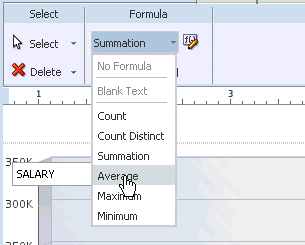 The chart changes to reflect the average salaries by department. 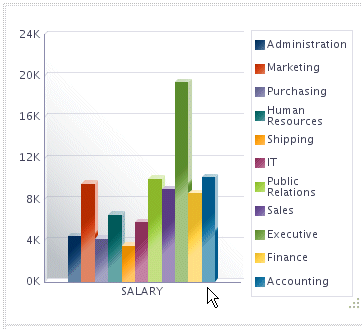 You can leave the default style for the chart or select from the supported chart styles. 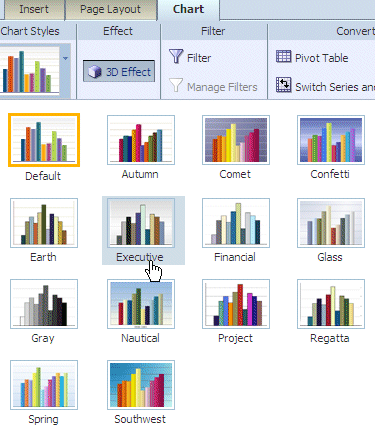 To add a title for the chart, first, Add a row above this chart in the grid layout. Select any of the the grid cells in the first row, and click the Add a Row Above icon. 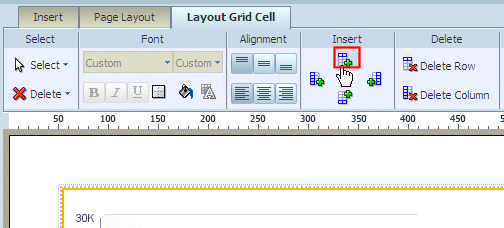 Now select the cell right above the chart, and click Insert tab , and then click Text Item. 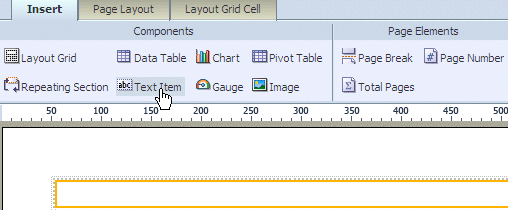 |
| 8 . | Next, add a title for the chart. Double click the text item to select it, then click again to edit it.
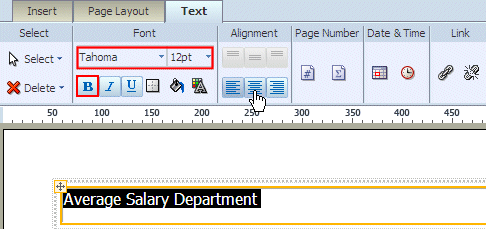 |
| 9 . | Click Save As icon in the toolbar, and save the Layout as Departmental Salaries. 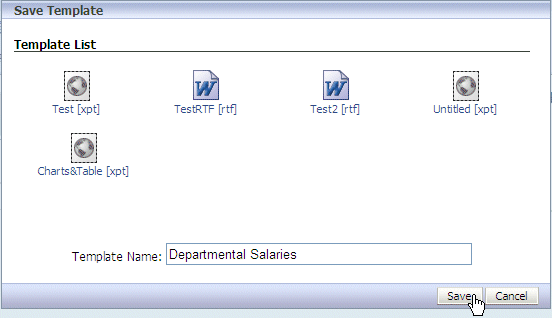 |
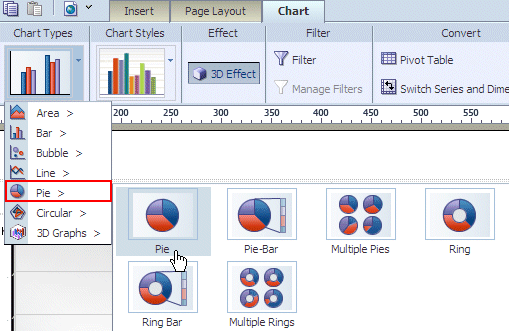
| 10 . | Return to complete the layout in the Layout Editor. Now, select the cell beside the bar chart that you have inserted. Follow the above steps to insert a Pie chart. The steps are briefly listed here:
|
Adding a Data Table to the Layout
| 1. | Select the lower row (which has the cells merged).
Click Insert tab. Click Data Table to insert the data table component into the layout.
 |
|---|---|
| 2. | Select and drag the elements in the following order from the Data Source pane to the [Drop a Data Item Here] area of the table:
After you insert all the columns notice that a Grand Total row is automatically inserted . 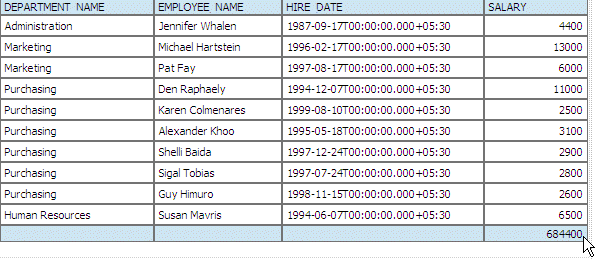 |
| 3 . | Click Preview in PDF icon in the toolbar to preview the layout -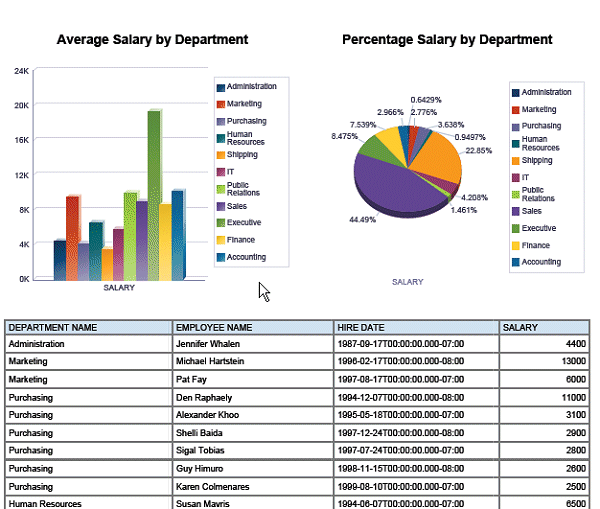 Click Save to to save the Departmental Salaries layout. Note: You can edit the layout that is saved in one of the following ways:
|
Formatting the Data, and Working with the Page Layout Features
Layout Editor enables you perform many formatting tasks such as -
- Change the back ground, text colors, and other text attributes
- Apply number formats
- Define groups/totals/ subtotals, and sorts
- Apply conditional formats
- Define page layout using headers, footers and page breaks.
Note: Most of the above formatting tasks can be done using the options in the menu ribbons. The most commonly used formatting properties are found in the context sensitive menu ribbons on the tool bar. For more fine grained properties, you can use the property pane on the left.
| 1 . | Changing Background, Text colors, and other Attributes : In the table select a column header, for example DEPARTMENT NAME. From the menu ribbon, change the properties as below: Font to Arial, Font Size to 10, and Font Weight to Bold.  |
|---|---|
| 2 . | Click Background Color icon from the properties listed in the Appearance section. Select a color (light blue is selected in the example here) from the Color Picker screen and click OK.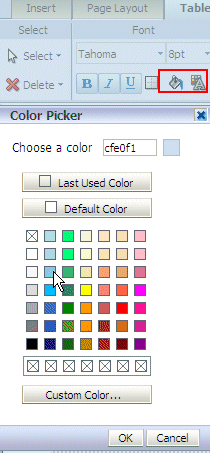 Similarly, click the Font color icon (highlighted in the screen) to change the text color for this column header. Select a color (like Dark blue) from the Color Picker. Change the background and text colors for all the column headers in-line with the DEPARTMENT_NAME. Hint: Use the <CTRL> and <SHIFT> keys to select the remaining columns headers, and change the background and text colors to the same colors you used for the DEPARTMENT NAME column header. Similarly, select the column footers (totals ) and change the colors . Note that the Properties pane (on the left) changes accordingly: 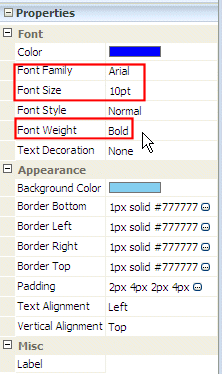 Similarly, apply same formats as above to the footer row (Totals row). |
| 3 . | Change the all the column (data cells) fonts to Arial with size 10. Click Save to to save the Departmental Salaries layout. The table should appear like this after the above formatting changes: 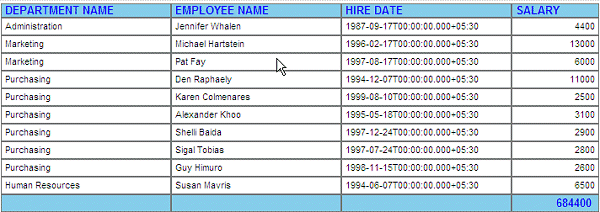 You can also modify the other properties such as Text Alignment. Ensure that the data in the numeric columns - such as SALARY is justified to the right . |
| 4 . |
Adding Number Formats:
You can add appropriate formats to the numeric or date columns such as SALARY, YEAR, HIRE DATE etc.
To change the format for SALARY, click anywhere below the column header in the data area to select SALARY column. From the Data Formatting drop down list, that is displayed in the ribbon, select $1,234.57 (Currency) as the format. 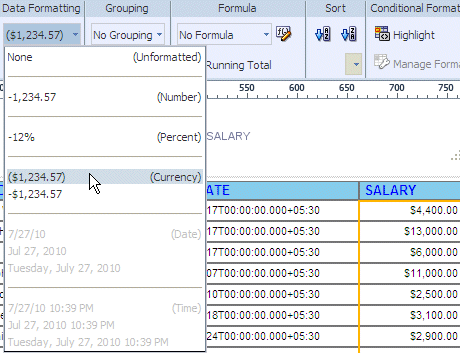
Similarly, select the same format for the Salary Total (last row). Click Save icon to save the changes to the Layout.
Now, adjust the decimal places to the right. Click Move Right twice to remove the decimals in Salary column and the Totals.

The table should now look like this (observe the formats for Salary column):
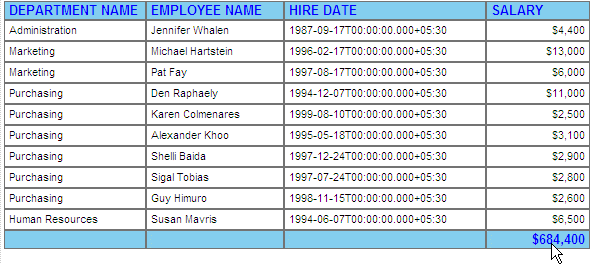 |
| 5 . | Similarly, click HIRE DATE column and apply the appropriate date formats: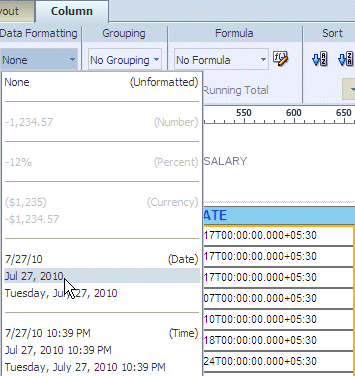 The table looks like this: 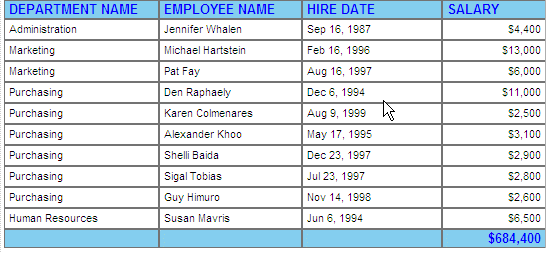 |
| 6 . | Defining Groups/Totals, and Sorts: In the table you can add groups, totals, and sorts. Click the data in the DEPARTMENT NAME column to select the same, and select Group Above from the Groupingdrop-down list that appears in the Column menu. 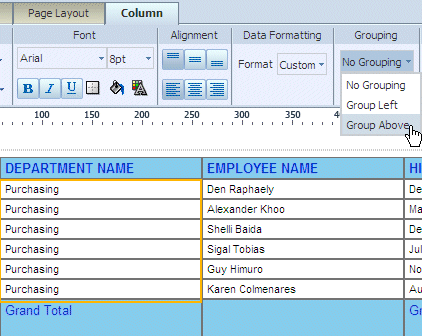 Note: Instead of using menu options, you can also drag DEPARTMENT NAME out of the table and drop it just above the table to add a repeating group. A total for the grouped column is automatically added at the end of the group in the table: Change the font, style, background and text colors as appropriate for DEPARTMENT NAME from the menu options in the ribbon. The table should appear like this after you defined a group on DEPARTMENT NAME column, and applied appropriate formats: 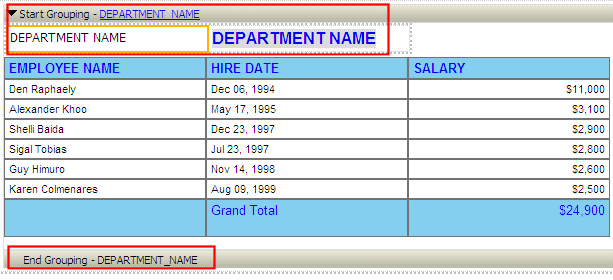 Note: Every time you make changes, do not forget to click Save and save the changes to the template. |
| 7 . | Click Preview in HTML icon to see the data in HTML.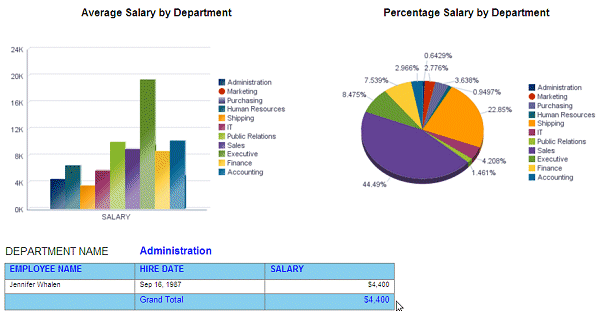 Scroll down to see the table: 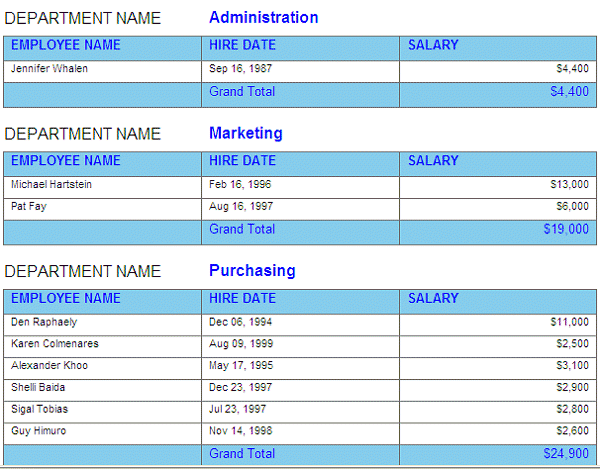 |
| 8 . | You can also define sorts on the columns in the table. You can define an ascending or descending sorts on columns. Select the data in EMPLOYEE NAME column and click Ascending Order (A-Z) icon in the Sort menu. The products are arranged in alphabetical order. 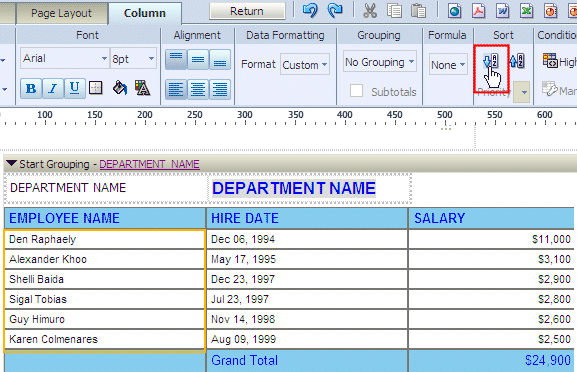 A portion of the data table, the data for the Purchasing department is shown below, note that the data is sorted by Employee Name: 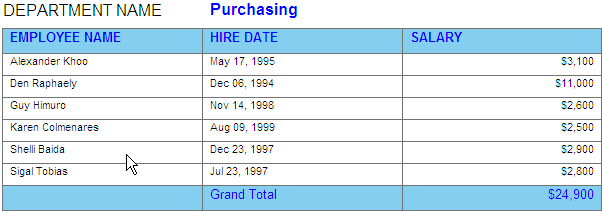 (You can also sort by salary, in which case a numeric sort is applied as appropriate.) |
| 9 . | Applying Conditional Formats: Conditional formats help you to highlight the data in fields based on a condition. For example, you may want to do a pay revision to reduce attrition rates, and may want to see which employees are earning very good salaries, and which employees are not earning so well (say less than 3000 USD). To apply simple conditional formats on SALARY select the data in the column and from the Conditional Formatting menu, click Highlight. 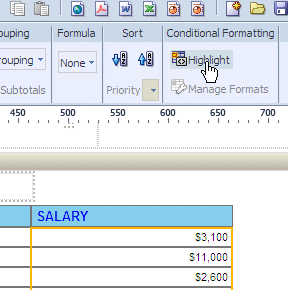 |
| 10 . | In the Highlight screen that appears, select is less than or equal to from the Operator drop-down list. Enter 3000as the Value. Set Bold as the Text style. Click the box beside the Background Color field. 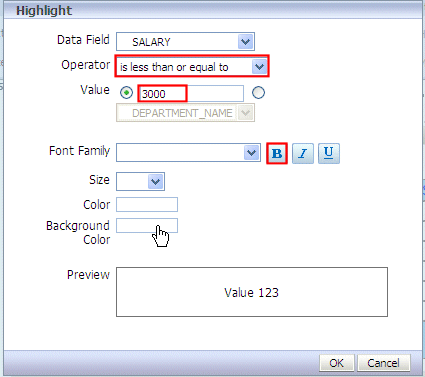 In the Color Picker, select Red as the background color. Click OK . 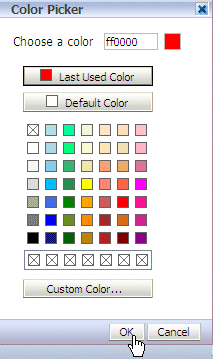 This takes you back to the Highlight definition dialog, preview how conditional format looks like and click OK. 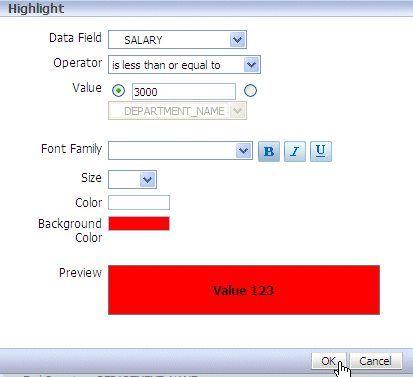 |
| 11 . | Define two more conditional formats as given below: 1. One with the Operator - is greater than, and enter the Value as 9000. Apply Green as the back ground color, and set Bold as font style. (See the screens below). Click OK. 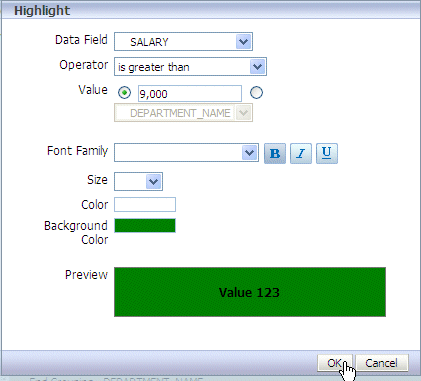 2. Also define a conditional format with the Operator - is between , and enter the Values as 3000 and 5000 . Applyyellow as the background color, and Bold as font style. (See the screen below). Click OK. 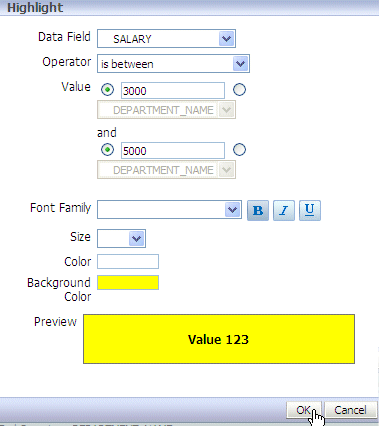 Click Save icon to save the Departmental Salaries template. |
| 12 . | Click Preview in HTML icon to see the data in HTML ( a portion of the table data is shown below, note that all the three conditional formats that you defined are applied on the SALARY column) .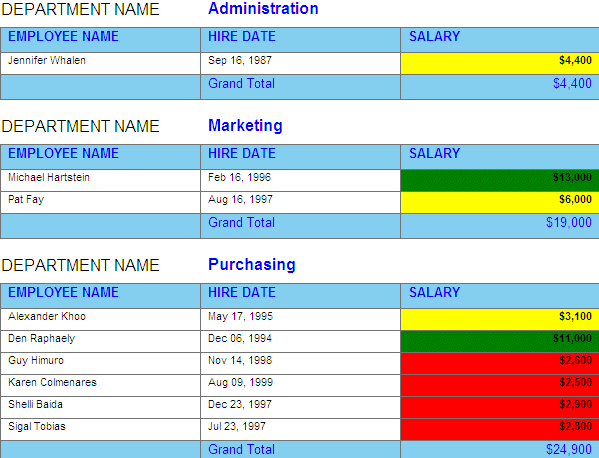 Note: Some of the salient features of Layout Editor that are helpful in creating report templates are briefly covered here. If you have time, try experimenting with other components , and other features such as section, pivot table, gauges, images, and Group Left with subtotals. |
| 13 . | Working with Page Layout Features: In the layout that you have created with the report components such as charts and table, you may want to add page breaks after each component, and in the table after each year. The next few steps guide you to add page breaks, headers , and/or footers to the report layout. In the grid layout , select the second row which has charts. Click Insert, and select Page Break from the Page Elements section in the menu.  Similarly, add a page break in the next row before the end of the section for DEPARTMENT NAME (group). Click inside the table just before the end of the section. Select Insert> Page break from the Page Elements section in the menu. (This inserts a page break after each department data in the table.) 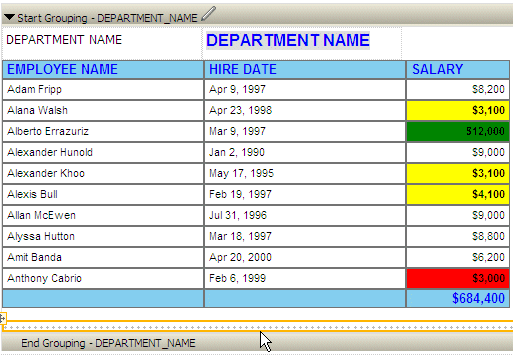 |
| 14 . | To see if the page breaks are inserted at right places, preview the layout in PDF. Click Preview in PDF icon. Notice the page breaks in the PDF file: 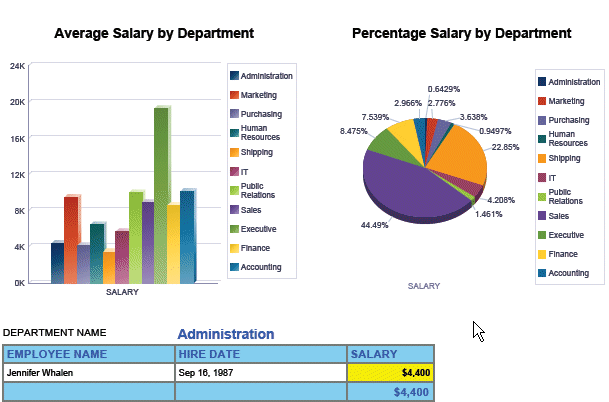 Scroll down to see the second page. Note that a page break is inserted after each department data: 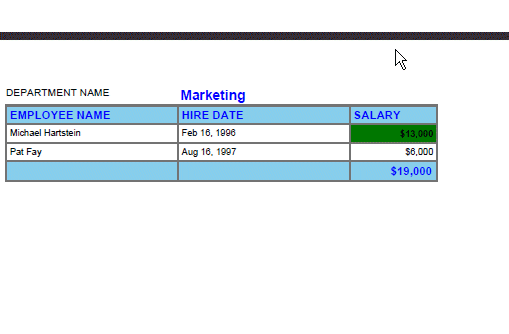 |
| 15 . | To insert page/report header and footers, click Page Layout. This displays all the menu options for Page Layout in the ribbon. Click Report Header. A report header (place holder) is inserted into the layout. 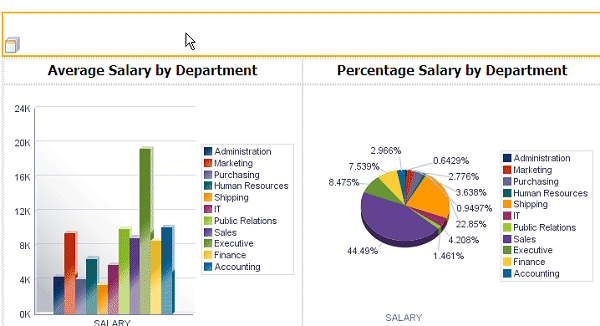 Insert a Text Item in the header, and double click the text item to edit it. Enter Employee Salary Analysis by Department as the report header. Apply appropriate formats for the report header. Preview the output in Interactive viewer. 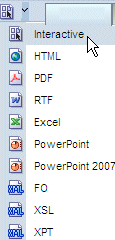 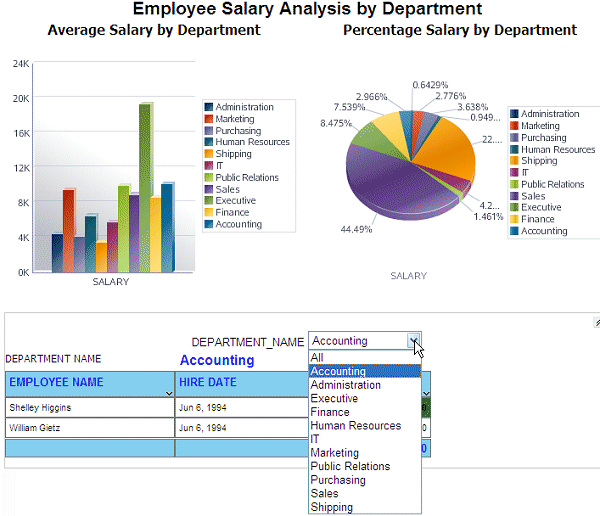 Observe that you can interactively select a department to view the data. Also, when you click the interactive ' v ' shaped icon for each column you can see the MS Excel like, interactive filtering and sorting features.  |
| 16 . | Similarly click Page Footer to insert a footer in the layout. An icon for the page footer at the end of the grid. Insert elements such as page numbers, simple text, time and date into these columns. An example is given here:
 The report with the headers and footers defined should look like this in PDF: 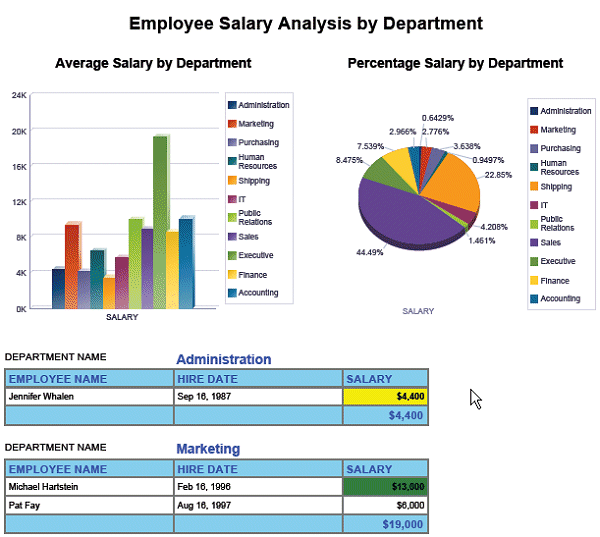 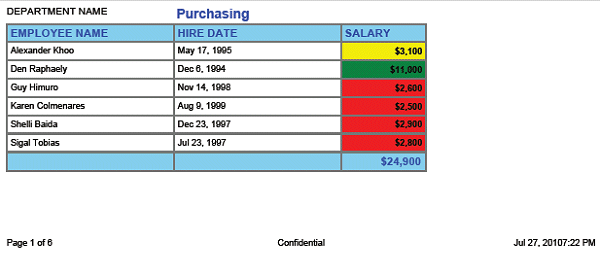 Note: If you have time, you can experiment with various elements such as gauges, images etc. |
Scheduling a Report
This topic guides you through the following subtopics:
- Confirming that the scheduler is configured
- Defining Delivery Destinations
- Creating Scheduled Report Jobs
- Managing Job History and Jobs
Confirming that the Scheduler is Configured
Oracle BI Publisher Enterprise enables you to schedule reports, and deliver the executed output to various destinations. BI Publisher Scheduler is configured as a part of Oracle BI Enterprise Edition installation process. However, ensure that the scheduler is configured properly, before you start scheduling the reports.
| 1 . | Log in (if not logged in) to BI Publisher (Web) as a user with BI Administrator privileges. Click Administration link (found at the right top corner of the BI Publisher page):  In the Administration page, click the Scheduler Configuration link in the System Maintenance section 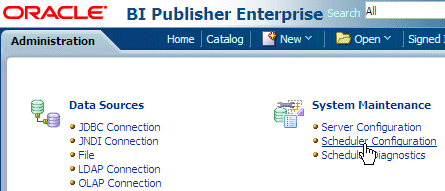 |
|---|---|
| 2 . | In the Scheduler Configuration page that appears, click Test Connection in the Database Connection section to check if the scheduler is configured properly.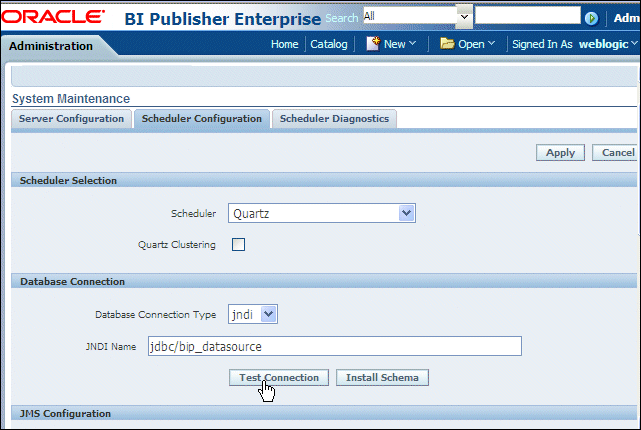 This should display the following message indicating the connection was successful: 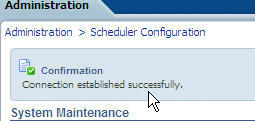 Now, you are ready to schedule your reports. |
Defining Delivery Destinations
Oracle BI Publisher enables you to setup different delivery destinations such as - Email, Printer, Fax, WebDAV, HTTP, and other destinations, so that you can deliver your reports to these destinations. This topic guides you how to set up your Email and WebDAV destinations using BI Publisher Administration page.
| 1 . | In the BI Publisher Administration page, ( you need to login to BI Publisher with BI Administrator privileges to access this page) you see a list of destinations in the Delivery section. Click Email link in the Delivery section. 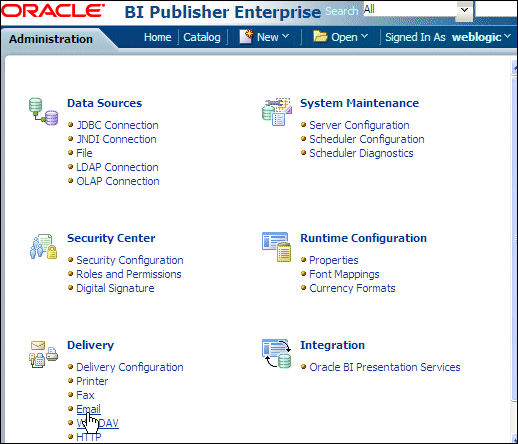 |
|---|---|
| 2 . | In the Email configuration page that appears, Click Add Server.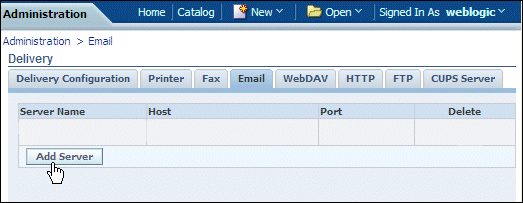 |
| 3. | In the Add Server page that appears,
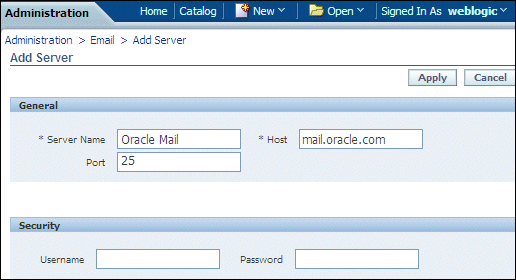 Important Note: You must enter a unique name for each server regardless of the type (printer, fax, email, WebDAV, or FTP). |
| 4. | Similarly, you can add a WebDAV server as one of the delivery destinations. Click WebDAV link in the Administration page, and click Add Server.
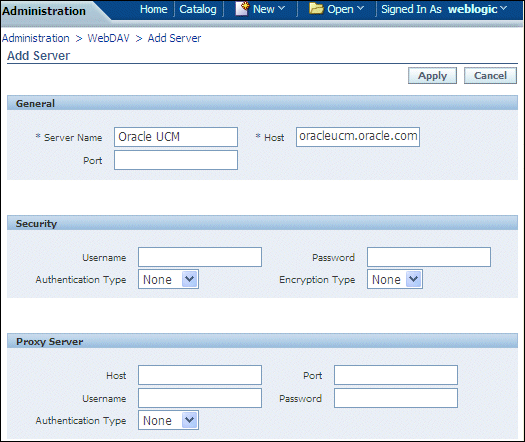 |
Creating Scheduled Report Jobs
| 1 . | Login (If not logged in) to BI Publisher and go to My Folders> Learn folder in Catalog. Click Schedule link found under the Employee Salaries by Department report. 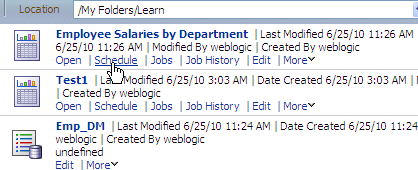 Note: If you do not see the Schedule link it is likely that you do not have Scheduler privileges or that the Scheduler is not configured properly. |
|---|---|
| 2 . | This displays the Schedule Report Job page. In the General tabbed page, you can select report name and parameter values (select All as the value for the Department report parameter). 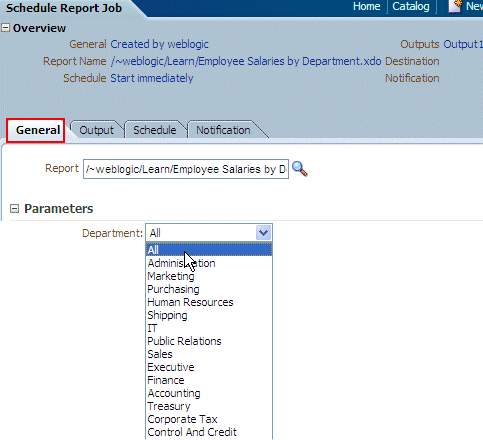 |
| 3 . | Click Output tab to define the output options. Ensure that "Use Bursting Definition to Determine Output& Delivery Destination" check box is not selected. Select the following options:
 |
| 4 . | Also, ensure that the Make Output Public option is not selected (if you select this option, all users can see the output of your scheduled report) , and Save Data for Republishing option is selected ( so that you can later republish the report with a different layout and output types). You can also add a delivery destination for the scheduled report. In the Destination section, select Email as theDestination Type and click Add Destination. 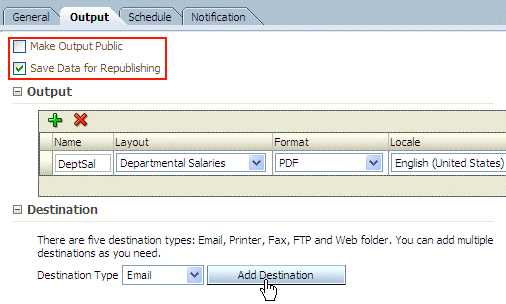 This shows an Email section below the Destination section. Add the mail ids in the To, CC, and Reply To fields as required, add a Subject to the mail, and type the message. 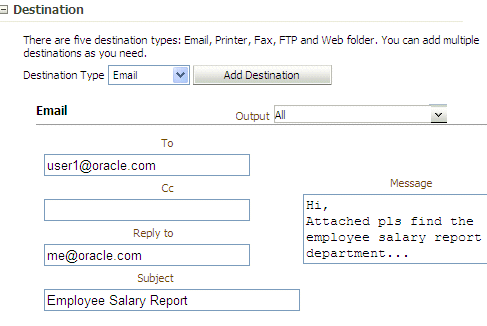 Note:
|
| 5 . | Click Schedule tab to define the scheduling options. Select Run Now option to run the job immediately. Select the Frequency as Once from the drop-down list. 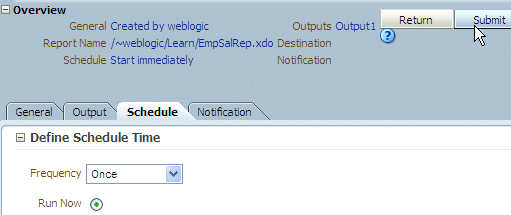 You can also add Email Notification options, (as you have already defined Email delivery destination). 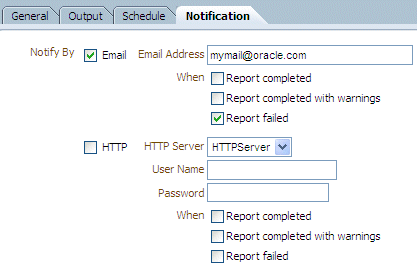 Click Submit to submit the schedule. |
| 6 . | Enter Employee Salaries by Department-Sched as the Job Name and click Submit again.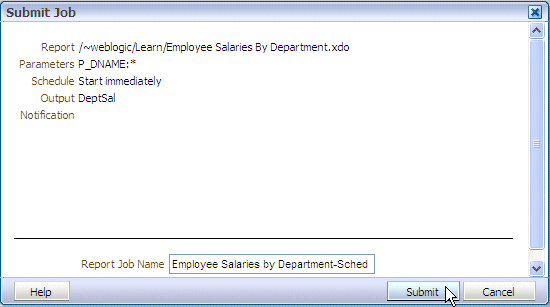 A message is displayed indicating that the job is submitted successfully. Click OK.  |
| 7 . | Scheduling a Report Job to run Weekly: Follow the steps 1 - 3 listed above to create this job. In step 4, click Schedule tab, and select the following options—
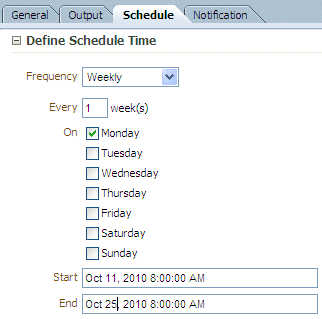 Click Submit to submit the job, and after specifying a name for the job click Submit again. Select some of the different Frequency patterns available for scheduling the jobs. Note that the Specific Datesoption allows you to create a completely custom pattern to meet whatever calendar requirements you have. 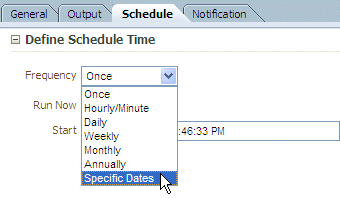 |
Managing Job History and Jobs
| 1 . | Click Open (found at the top right corner of the page) and select Report Job History. The Report Job History page displays information about running and completed report jobs. You can see the report job that you created in the list as shown in the screen below. ( Note that the job status indicates success). Click the job name link ( Employee Salaries by Department -Sched) . 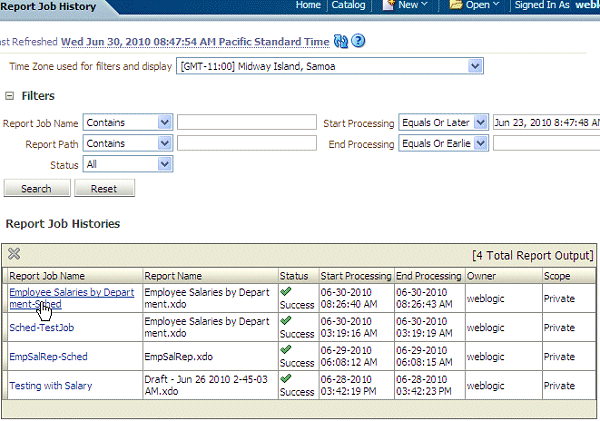 You can also enter appropriate Search criteria to search for reports or search for the job history for a specific report. Observe the various search criteria that you can use. |
|---|---|
| 2 . | General job information and other job execution details are displayed for the specific report. Click DeptSal (in the Output Name column) , to see the scheduled report output using the Departmental Salaries layout that you created.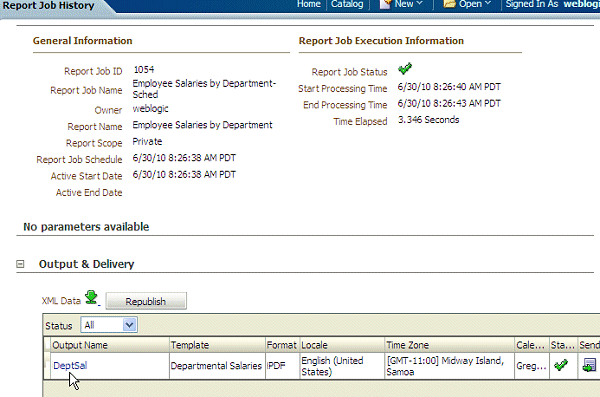 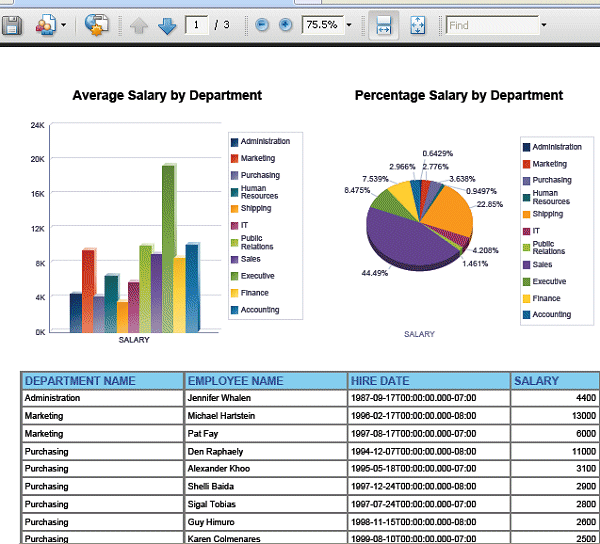 Click Return in BI Publisher. Note: You can also click the Republish option to republish the scheduled job with a different layout and output options. |
| 3 . | Similarly, click Report Jobs to see the Manage Report Jobs page. This page page displays information about jobs that are scheduled for future dates, and also recurring report jobs. You can pause, resume, edit, or delete report jobs from this page. 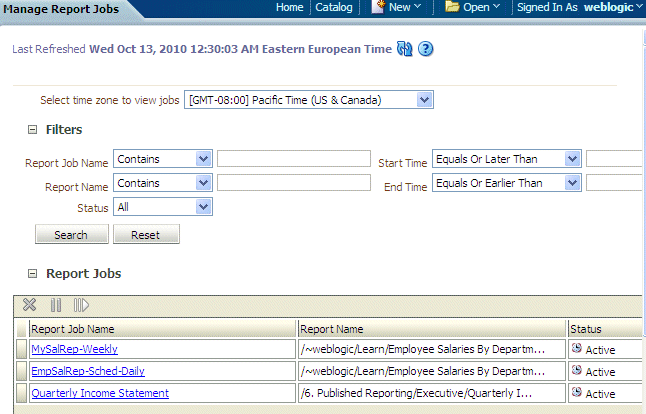 |
| 4 . | Click in the column beside a job name to select that job. Click Pause to suspend the job. (Observe that the job status changes to Paused.)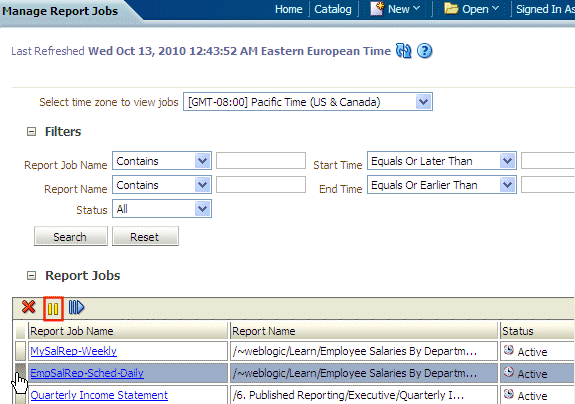 If you want to resume the same, click Resume. Similarly, click Delete if you would like to delete the job. 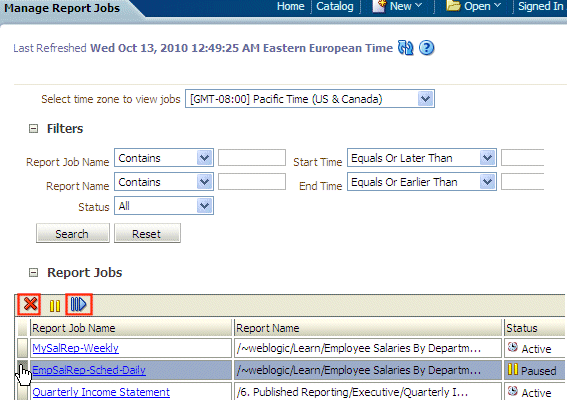 |
Summary
In this tutorial, you have learned how to:
- Configure Data Sources
- Create Data Model based on SQL query
- Create and view simple reports
- Build layouts using Layout Editor
- Schedule Report Jobs
- Manage Job History and Jobs
Resources
- To learn more about BI Publisher, refer to additional OBEs on the OTN Web site (can link to a specific set of OBEs on the subject)
No comments:
Post a Comment